Where immigration raids happen in London
A deep dive into our FOI data
The data
Researchers from the Anti-Raids Network have uncovered data on where immigration raids happen in London. This data gives counts of immigration raids, broken down by:
- year
- the first bit of the postcode – e.g. N15, E6 – which we call postcode area
Where do lots of raids happen?
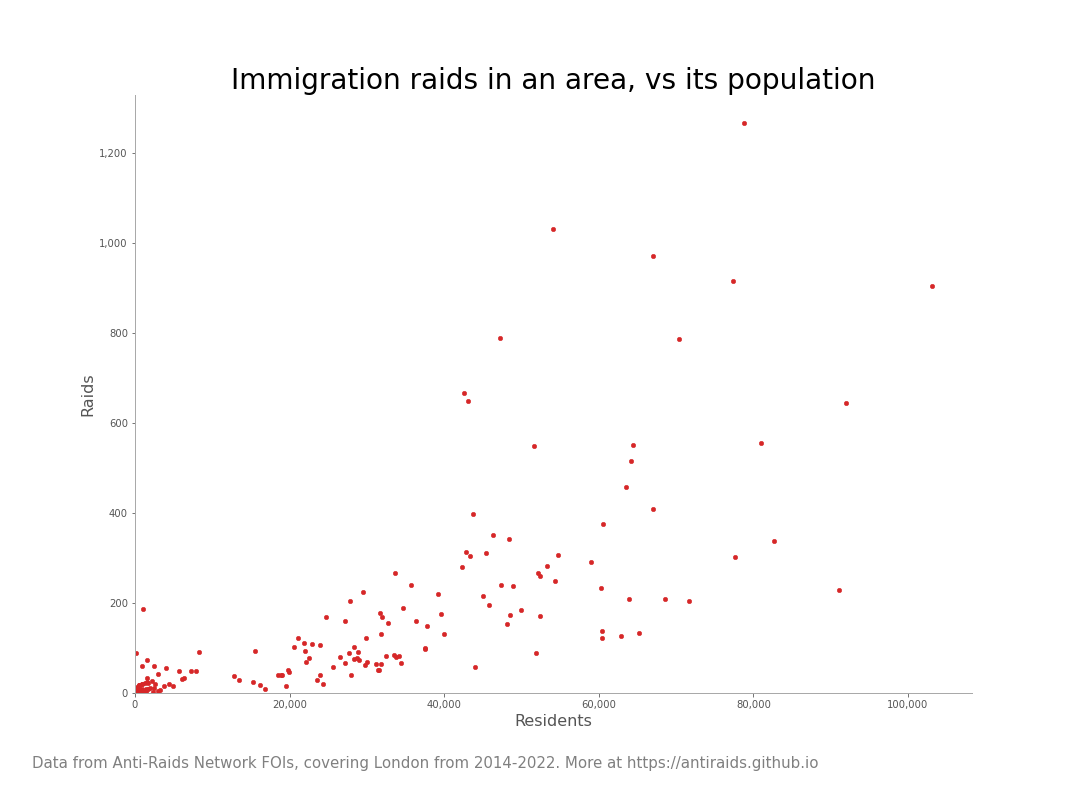
There is no single huge outlier area, with loads more raids happening there than elsewhere. In general, the more people living in an area, the more raids there are:
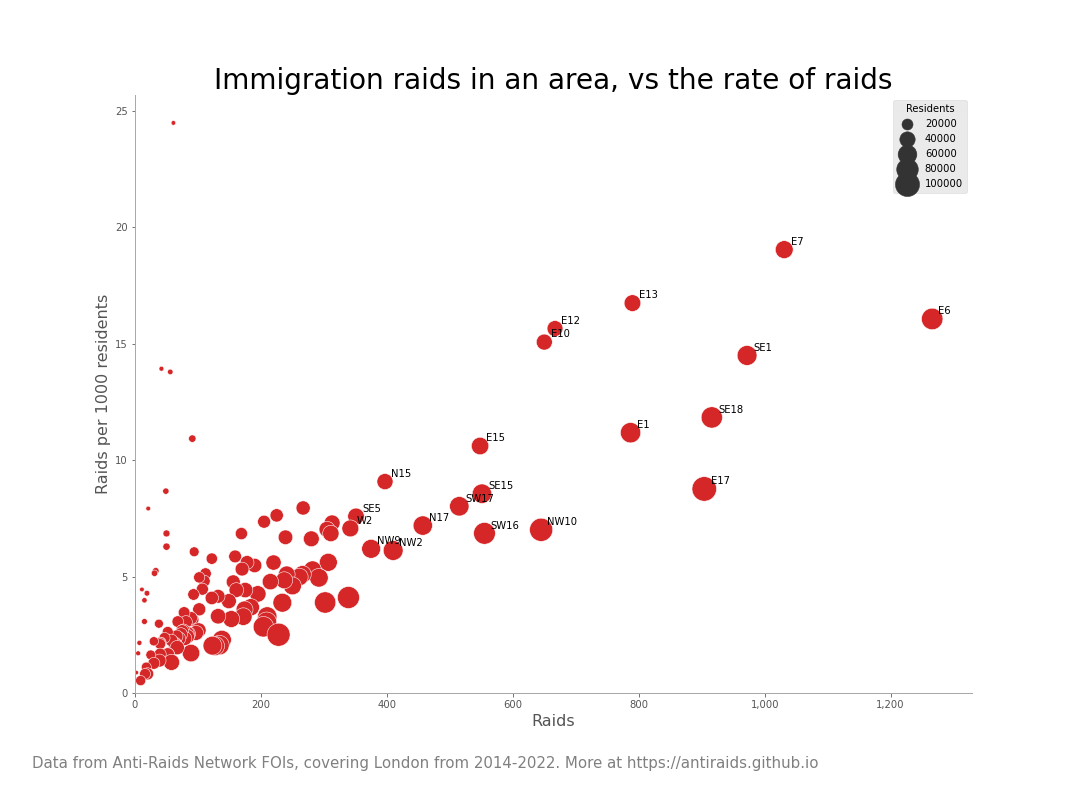
As a network of anti-raids groups, we want to know areas where there are both a high number of raids, and a high rate of raids -- as they could be prime areas for new anti-raids organising.
Looking from this angle, in the top 20 there are areas covered by existing anti-raids groups — e.g. N15 and N17 by Haringey Anti-Raids, E15 by Newham Anti-Raids — but also lots of areas without known organisations working against raids.
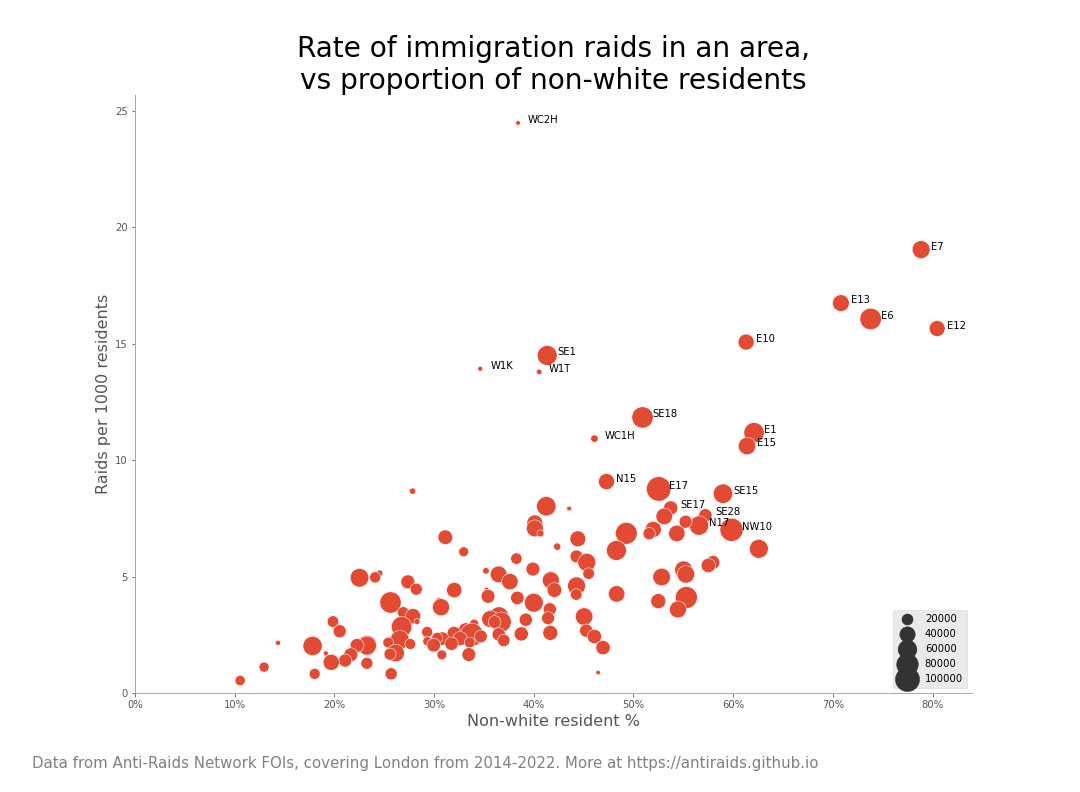
Why are there more immigration raids in some places than others?
Given how immigration enforcement officers love their racial profiling, we looked into whether there was any link between where immigration raids happen and where communities of colour live. And sure enough, the more residents of colour in an area, the more it was targeted by immigration enforcement.
Not all migrant communities are harassed by ICE equally. In other reports, for example we see Indian and Pakistani migrants making up a high proportion of people deported, vs a relatively low rate of people from the Middle East. And that seems to be broadly in line with our immigration raids data:
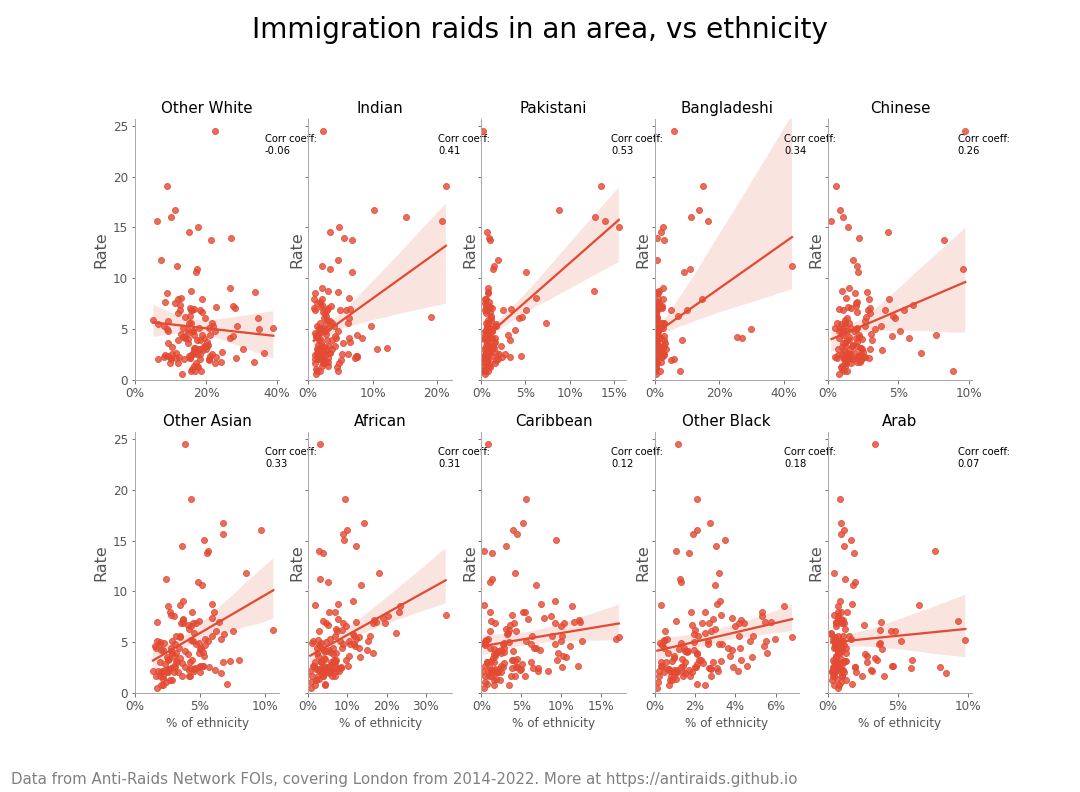
Doing a deep-dive into the stats, we see that areas with higher %s of Pakistani, Bangladeshi, African or Chinese residents see higher rates of immigration raids (you can check our working on our Github). This broadly matches (with some nuance) with data on countries deported to from the UK:
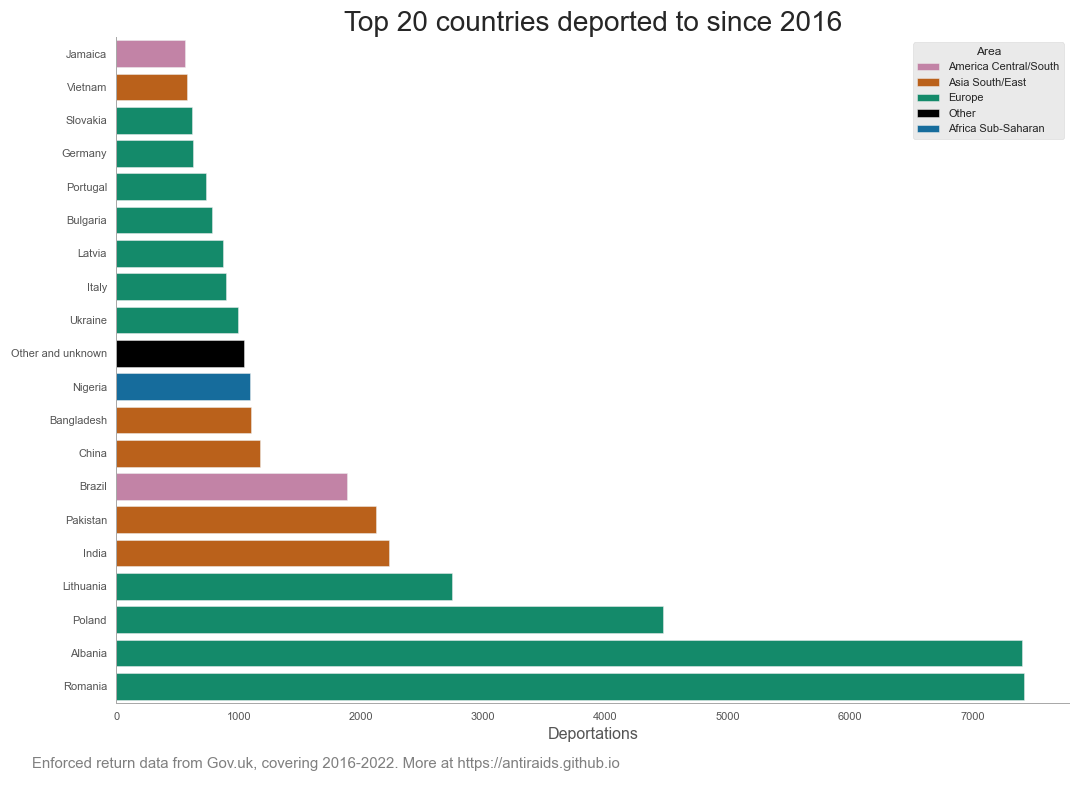
How many racialised migrants an area has is just one reason why your area might get targeted for immigration raids. For example, the above shows how many migrants from eastern European countries are tied up in the immigration detention system. Feel free to grab the FOI data itself, to see if you can find any other links.
Have raids gone up or down in the last few years?
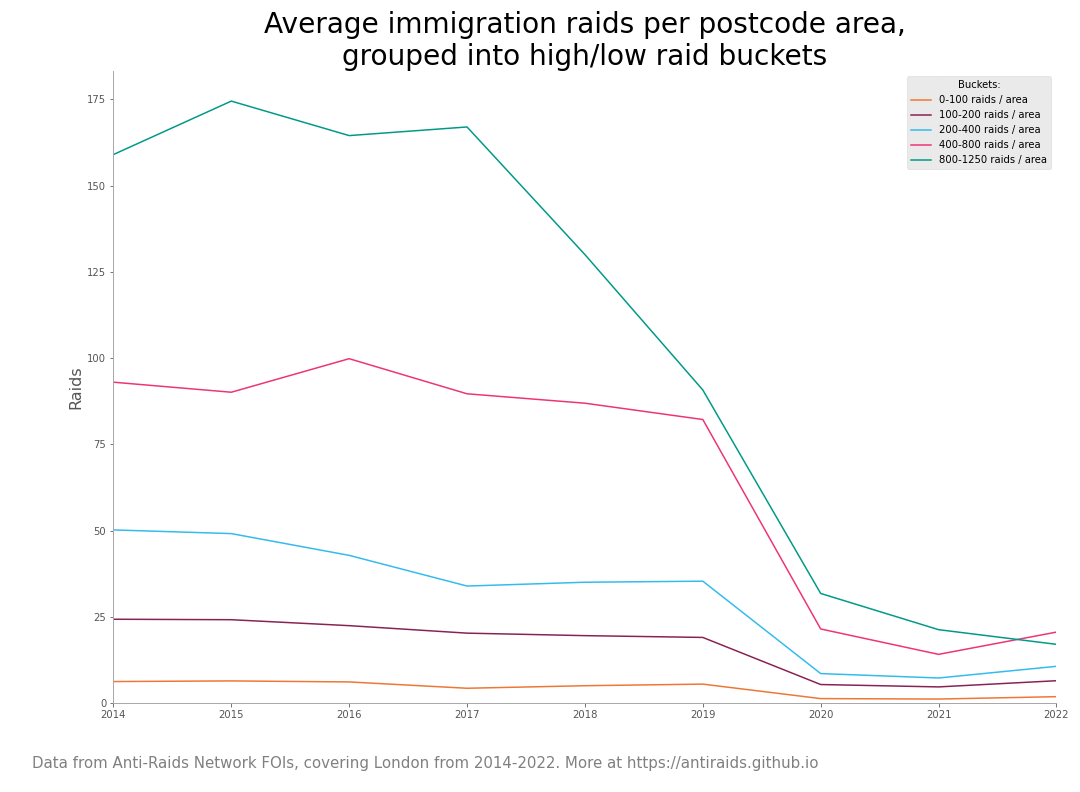
Before the pandemic, there wasn't a simple narrative like "raids have consistently fallen over the last few years". Some areas went up, some went down, some were all over the shop.
One trend that looked like it was starting was a drop in the areas where there were the most raids 2014-7 (150+/year).
But now, one thing stands out above all else: in 2020-22, the years of the pandemic, there was a huge drop in immigration raids basically across the board. The areas with the most raids before the pandemic continued their decline, and saw the biggest drops. That has started to creep up again in 2022, but is still far below the 2014-2019 volumes.
Digging down to your area
To make the data a bit easier to plough through, we have broken it down into line graphs for each section of inner London:
Use the legend in the sidebar to highlight postcode areas. Use the controls at the bottom to zoom in, scroll around, and reset.
Raids across London
Use the search bar on the left to zoom in on a postcode area (e.g. E9). Use the selector on the right to toggle between the absolute count of raids, and the relative rate of raids per 1000 residents.